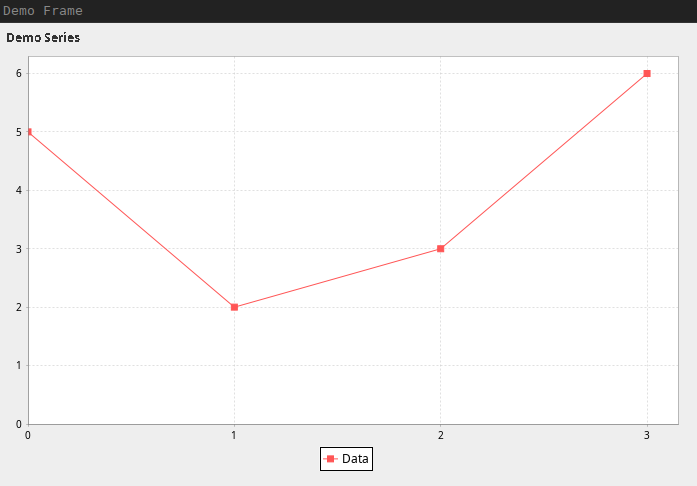
I was writing a Clojure Swing application [using seesaw]](https://github.com/clj-commons/seesaw) that would benefit from a basic line graph. This was an annoying problem for me because I didn’t want to try and do that by hand. Fortunately it turns out that not only does Java have a plotting library but it is actually remarkably good for easy things (not quite up to the standard of Hadley Wickham’s ggplot, but not much is). There is also the Clojure library Incanter but I didn’t explore it.
Debian testing, 2024-03-26.
$ sudo apt install libjfreechart-java
$ dpkg -L libjfreechart-java | grep jar
/usr/share/java/jfreechart-1.0.19.jar
/usr/share/java/jfreechart.jar
/usr/share/maven-repo/org/jfree/jfreechart/1.0.19/jfreechart-1.0.19.jar
/usr/share/maven-repo/org/jfree/jfreechart/debian/jfreechart-debian.jarproject.clj:
(defproject demo "1.0.0-SNAPSHOT"
  :license {:name "EPL-2.0 OR GPL-2.0-or-later WITH Classpath-exception-2.0"
            :url "https://www.eclipse.org/legal/epl-2.0/"}
  :dependencies [[org.clojure/clojure "1.11.2"]
                 ;; Swing GUI library
                 [seesaw              "1.5.0"]]
  :main demo.core
  ;; Dependency on JFreeChart
  :resource-paths ["/usr/share/maven-repo/org/jfree/jfreechart/debian/jfreechart-debian.jar" "resources/"]
  :target-path "target/%s"
  :profiles {:uberjar {:aot :all
:jvm-opts ["-Dclojure.compiler.direct-linking=true"]}})(ns demo.core
(:require
[seesaw.core :as seesaw]
[seesaw.mig :as mig])
(:import
[org.jfree.chart ChartPanel JFreeChart]
[org.jfree.chart.plot XYPlot]
[org.jfree.chart.axis NumberAxis NumberTickUnit]
[org.jfree.data.xy DefaultXYDataset]
[org.jfree.chart.renderer.xy DefaultXYItemRenderer]))JFreeChart requires us to create a few things:
(defn build-dataset-backing-array
  [series]
  (into-array (map double-array [(-> series count range) series])))
This was the part that was trickiest. If we want to plot some series
(say [5 2 3 6]) then we need a 2D structure with the range and range
specified [#_domain [1 2 3 4] #_range [5 2 3 6]] - but
structured as a 2D double array. Clojure doesn’t give us tools to
directly create a 2D array, but it turns out to be possible by creating
2xdouble arrays in the above fashion. I chose to add the array after
constructing the dataset using addSeries.
This seems to be the standard way since I only see a plain constructor -
it may have been the only choice.
Thanks Fogus for explaining to everyone how that is done.
The design here by JFreeChart impressed me. This level of separation between display and data is well advised in a charting library and the interface looks to be quite flexible in the face of odd situations. It would be easy to create an XYPlot that coupled the data and the plot itself but someone here has gone the extra distance to keep things organised. There is also a balance between boilerplate and simplicity that seemed well navigated by this API.
(defn build-chart
  []
  (ChartPanel.
   (JFreeChart.
    (XYPlot. (DefaultXYDataset.)
             (doto (NumberAxis.) (.setTickUnit (NumberTickUnit. 1.0)))
             (doto (NumberAxis.) (.setTickUnit (NumberTickUnit. 1.0)))
             (DefaultXYItemRenderer.)))))
nil is acceptable for the arguments to XYPlot, but I
started out with a nil renderer and the data didn’t render.
Being able to pass nil seems like a red herring here.
I’m experimenting with to creating maps like this:
#__(def ui
  {:plot plot
   :chart chart
   :panel chart-panel})
To store UIs, then passing them around in lieu of using a global
variable. It seems to work well - individual components are easy to get
to and often there is a :layout in the map to talk about
the whole blob. I don’t break the chart up (into separate
panel/plot/dataset) in this case because this is a limited graph, so
when I want to update the dataset I’ll reach in through the
components.
(defn build-ui
  []
  (let [chart
        (build-chart)]
  {:chart-panel chart
   :layout (mig/mig-panel :items [[(seesaw/label "Demo Series") "wrap"]
                                  [chart ""]])}))


(defonce f
  (seesaw/frame :title "Demo Frame"
                :visible? false))

(defn -main
  [& _args]
  (let [ui (build-ui)]
    (-> ui :chart-panel .getChart .getPlot .getDataset (.addSeries "Data" (build-dataset-backing-array [5 2 3 6])))
    ;; Multiple series supported like this
    ;; (-> ui :chart-panel .getChart .getPlot .getDataset (.addSeries "Data2" (build-dataset-backing-array [6 3 2 5])))
    (seesaw/config! f :content (:layout ui))
    (seesaw/show! f)))

(-main)
I was worried that using plot-graph-chart interchangeably here was not technically correct. Apparently a line graph is at once a plot, a graph and a chart so that use is acceptable.